
Blog
11kV Triplex Cable Joint (UKPN)
June 15th, 2021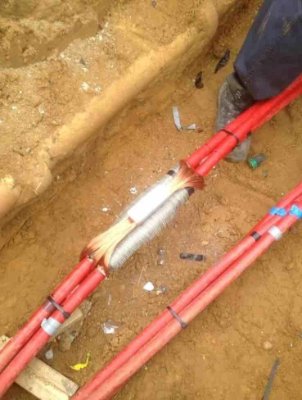
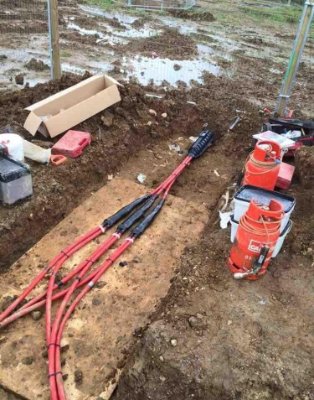
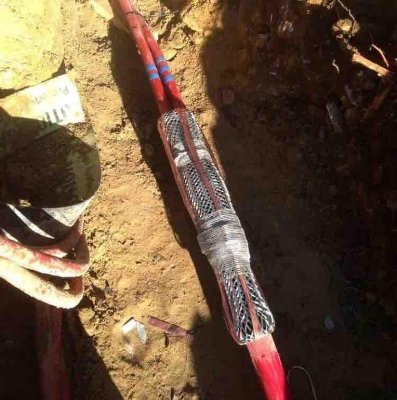
11kV Triplex Cable Joint (UKPN)
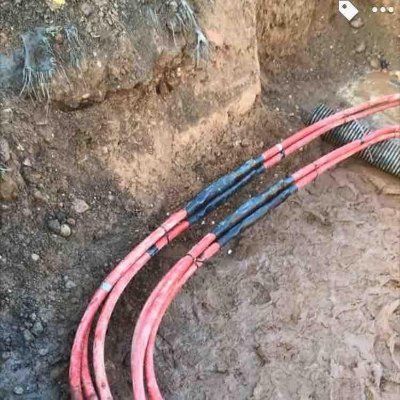
2x Triplex Straight Joints 11kV
11kV Heat Shrink Breech Joint & Pot End
11kV Polymeric To Triplex Straight Joint
Pictured: 11kV Triplex Cable Joint (UKPN)
Images Courtesy of: Lee Richards : Cable Jointer LV, 11kV, 33kV at Power On Connections
Lee has over 10 years experience working within the electrical profession and currently works for Power On Connections, the UK’s leading Independent Connctions Provider (ICP). Lee has developed and increased cable jointing skills through continued training that enable him to work in a range of different electrical environments, including jointing 11kV Triplex cables.
His current role entails working on the companies’ electrical network carrying out cable jointing tasks of LV and HV cable joints and terminations up to 33kV. Installing substation earthing systems, wiring and termination of rising mains and multiple distribution boards for apartment blocks. Carrying out live cable joints onto the local DNO network – SSE, UKPN, (trade test approved) and WPD IDNO approved.
Cable Experience
LV – Wavecon, PILC, Consac Cable Jointing
HV – Polymeric, Triplex, EPR (Lovink cable joints and terminations on plastic and transitional joints)
![]()
Jointers blog
Subscribe now to our POWER NEWSLETTER– a monthly email circulation packed with news, projects, videos, technical tips, training information, promotions, webinars, career opportunities and white papers.
Includes access to our popular JOINTERS BLOG with contributions from utility professionals, linesmen and cable jointers working on MV HV EHV cables and overhead lines typically at 11kV, 33kV, 66kV and up to 132kV.
15,000+ Subscribers. ➡ 
Global Medium Voltage Cable Accessories Market (2019 – 2027)
June 15th, 2021")
To Purchase Report Click Here
Medium Voltage Cable Accessories
-
Special thanks to Research and Markets for the kind permission to republish
Foreword
The “Medium Voltage Cable Accessories Market by Product Type, Technology, Installation and Industry Vertical: Global Opportunity Analysis and Industry Forecast, 2019-2027” report has been added to ResearchAndMarkets.com’s offering.
The Global medium voltage cable accessories market was valued at $16.82 billion in 2019, and is projected to reach $22.15 billion by 2027, registering a CAGR of 5.40% from 2020 to 2027. Medium voltage (MV) is a range of electricity distribution system voltages from 3.3kV to 33kV. Cable accessories for medium voltage have similar design and performance requirements as that of cables of same voltage range.
A substantial investment in the construction sector majorly drives the growth of the global medium voltage cable accessories market, as growth of the construction sector directly increases the demand for medium voltage cable accessories for new constructions.
Moreover, surge in use of underground cables with rise in urbanization and industrialization, increase investments for infrastructure development both by private and public sector, and rise in focus on sustainable ways of generating electricity are expected to boost market growth.
Furthermore, growth in adoption of e-mobility, surge in governmental initiatives to provide electricity for all, and surge in number of data centers are expected to provide lucrative growth opportunities for the market. However, high rate of failure of heat shrink medium voltage cable accessories are expected to hinder the growth of the global medium voltage cable accessories market.
The global medium voltage cable accessories market is analyzed by product type, technology, industry vertical, and region. By product type, it is fragmented into cable joints & splice, connectors, terminations, and other product types. By technology, the market is segregated into heat shrink, cold shrink, and pre-molded terminations.
By installation, the market is analyzed across overhead, underground, and submarine. By industry vertical, the market is divided into railways, construction, private utilities, cement, marine, government utilities, oil & gas, healthcare, fertilizer, steel, and others.
Based on region, the global medium voltage cable accessories market is analyzed across North America (the U.S., Canada, and Mexico), Europe (the UK, Germany, France, and rest of Europe), Asia-Pacific (China, India, Japan, and rest of Asia-Pacific), and LAMEA (Latin America, Middle East, and Africa).
The key players operating in the market include 3M, Compaq International (P) Limited, Nexans, NKT A/S, Phoenix Technology Group Co., Ltd., Raychem AG, REPL International Limited, Sumitomo Electric U.S.A., Inc., TE Connectivity, and Yamuna Infra & Technology Pvt.
KEY MARKET SEGMENTS
By PRODUCT TYPE
- Cable Joints & Splice
- Connectors
- Terminations
- Other Product Types
By TECHNOLOGY
- Heat Shrink
- Cold Shrink
- Pre-molded Terminations
By INSTALLATION
- Overhead
- Underground
- Submarine
By INDUSTRY VERTICAL
- Railways
- Construction
- Private Utilities
- Cement
- Marine
- Government Utilities
- Oil & Gas
- Healthcare
- Fertilizer
- Steel
- Others
By REGION
- North America
- U.S.
- Canada
- Mexico
- Europe
- UK
- Germany
- France
- Rest of Europe
- Asia-Pacific
- China
- India
- Japan
- Rest of Asia-Pacific
- LAMEA
- Latin America
- Middle East
- Africa
KEY PLAYERS
- 3M
- Compaq International (P) Limited
- Nexans
- NKT A/S
- Phoenix Technology Group Co., Ltd
- Raychem AG
- REPL International Limited
- Sumitomo Electric U.S.A., Inc.
- TE Connectivity
- Yamuna Infra & Technology Pvt. Ltd.
Table of Contents
Chapter 1: Introduction
1.1. Report Description
1.2. Key Benefits for Stakeholders
1.3. Key Market Segments
1.4. Research Methodology
1.4.1. Primary Research
1.4.2. Secondary Research
1.4.3. Analyst Tools and Models
Chapter 2: Executive Summary
2.1. Key Findings
2.1.1. Top Impacting Factors
2.1.2. Top Investment Pockets
2.2. Cxo Perspective
Chapter 3: Market Overview
3.1. Market Definition and Scope
3.2. Porter’s Five Forces Analysis
3.3. Market Dynamics
3.3.1. Drivers
3.3.1.1. Increase Investments by Governments to Improve Power Grid
3.3.1.2. Increase in Use of Underground Cables
3.3.1.3. Growth Investments in Construction Sector
3.3.2. Restraint
3.3.2.1. High Failure Rate of Medium Voltage Cable Accessories
3.3.3. Opportunities
3.3.3.1. Rise in Use of E-Mobility
3.3.3.2. Surge in Number of Data Centers
3.4. COVID Impact
3.4.1. Impact on Market Size
3.4.2. Impact on Product Pricing
3.4.3. Industry Vertical Trends, Preferences, and Budget Impact
3.4.4. Key Player Strategies to Tackle Negative Impact
3.4.4.1. Limiting Cuts to R&D Expense
3.4.4.2. Focusing on Next-Generation Products
3.4.4.3. Shifting Toward Agile Supply Chain Model
3.4.5. Opportunity Window
Chapter 4: Medium Voltage Cable Accessories Market, by Product Type
4.1. Overview
4.2. Cable Joints & Splice
4.2.1. Key Market Trends, Growth Factors, and Opportunities
4.2.2. Market Size and Forecast, by Region
4.2.3. Market Analysis, by Country
4.3. Connectors
4.3.1. Key Market Trends, Growth Factors, and Opportunities
4.3.2. Market Size and Forecast, by Region
4.3.3. Market Analysis, by Country
4.4. Terminations
4.4.1. Key Market Trends, Growth Factors, and Opportunities
4.4.2. Market Size and Forecast, by Region
4.4.3. Market Analysis, by Country
4.5. Others
4.5.1. Key Market Trends, Growth Factors, and Opportunities
4.5.2. Market Size and Forecast, by Region
4.5.3. Market Analysis, by Country
Chapter 5: Medium Voltage Cable Accessories Market, by Technology
5.1. Overview
5.2. Heat Shrink
5.2.1. Key Market Trends, Growth Factors, and Opportunities
5.2.2. Market Size and Forecast, by Region
5.2.3. Market Analysis, by Country
5.3. Cold Shrink
5.3.1. Key Market Trends, Growth Factors, and Opportunities
5.3.2. Market Size and Forecast, by Region
5.3.3. Market Analysis, by Country
5.4. Pre-Molded Terminations
5.4.1. Key Market Trends, Growth Factors, and Opportunities
5.4.2. Market Size and Forecast, by Region
5.4.3. Market Analysis, by Country
Chapter 6: Medium Voltage Cable Accessories Market, by Installation
6.1. Overview
6.2. Overhead
6.2.1. Key Market Trends, Growth Factors, and Opportunities
6.2.2. Market Size and Forecast, by Region
6.2.3. Market Analysis, by Country
6.3. Underground
6.3.1. Key Market Trends, Growth Factors, and Opportunities
6.3.2. Market Size and Forecast, by Region
6.3.3. Market Analysis, by Country
6.4. Submarine
6.4.1. Key Market Trends, Growth Factors, and Opportunities
6.4.2. Market Size and Forecast, by Region
6.4.3. Market Analysis, by Country
Chapter 7: Medium Voltage Cable Accessories Market, by Industry Vertical
7.1. Overview
7.2. Railways
7.2.1. Key Market Trends, Growth Factors, and Opportunities
7.2.2. Market Size and Forecast, by Region
7.2.3. Market Analysis, by Country
7.3. Construction
7.3.1. Key Market Trends, Growth Factors, and Opportunities
7.3.2. Market Size and Forecast, by Region
7.3.3. Market Analysis, by Country
7.4. Private Utilities
7.4.1. Key Market Trends, Growth Factors, and Opportunities
7.4.2. Market Size and Forecast, by Region
7.4.3. Market Analysis, by Country
7.5. Cement
7.5.1. Key Market Trends, Growth Factors, and Opportunities
7.5.2. Market Size and Forecast, by Region
7.5.3. Market Analysis, by Country
7.6. Marine
7.6.1. Key Market Trends, Growth Factors, and Opportunities
7.6.2. Market Size and Forecast, by Region
7.6.3. Market Analysis, by Country
7.7. Government Utilities
7.7.1. Key Market Trends, Growth Factors, and Opportunities
7.7.2. Market Size and Forecast, by Region
7.7.3. Market Analysis, by Country
7.8. Oil & Gas
7.8.1. Key Market Trends, Growth Factors, and Opportunities
7.8.2. Market Size and Forecast, by Region
7.8.3. Market Analysis, by Country
7.9. Healthcare
7.9.1. Key Market Trends, Growth Factors, and Opportunities
7.9.2. Market Size and Forecast, by Region
7.9.3. Market Analysis, by Country
7.10. Fertilizer
7.10.1. Key Market Trends, Growth Factors, and Opportunities
7.10.2. Market Size and Forecast, by Region
7.10.3. Market Analysis, by Country
7.11. Steel
7.11.1. Key Market Trends, Growth Factors, and Opportunities
7.11.2. Market Size and Forecast, by Region
7.11.3. Market Analysis, by Country
7.12. Others
7.12.1. Key Market Trends, Growth Factors, and Opportunities
7.12.2. Market Size and Forecast, by Region
7.12.3. Market Analysis, by Country
Chapter 8: Medium Voltage Cable Accessories Market, by Region
8.1. Overview
8.2. North America
8.2.1. Key Market Trends, Growth Factors, and Opportunities
8.2.2. Market Size and Forecast, by Product Type
8.2.3. Market Size and Forecast, by Technology
8.2.4. Market Size and Forecast, by Installation
8.2.5. Market Size and Forecast, by Industry Vertical
8.2.6. Market Analysis, by Country
8.2.6.1. U.S.
8.2.6.1.1. Market Size and Forecast, by Product Type
8.2.6.1.2. Market Size and Forecast, by Technology
8.2.6.1.3. Market Size and Forecast, by Installation
8.2.6.1.4. Market Size and Forecast, by Industry Vertical
8.2.6.2. Canada
8.2.6.2.1. Market Size and Forecast, by Product Type
8.2.6.2.2. Market Size and Forecast, by Technology
8.2.6.2.3. Market Size and Forecast, by Installation
8.2.6.2.4. Market Size and Forecast, by Industry Vertical
8.2.6.3. Mexico
8.2.6.3.1. Market Size and Forecast, by Product Type
8.2.6.3.2. Market Size and Forecast, by Technology
8.2.6.3.3. Market Size and Forecast, by Installation
8.2.6.3.4. Market Size and Forecast, by Industry Vertical
8.3. Europe
8.3.1. Key Market Trends, Growth Factors, and Opportunities
8.3.2. Market Size and Forecast, by Product Type
8.3.3. Market Size and Forecast, by Technology
8.3.4. Market Size and Forecast, by Installation
8.3.5. Market Size and Forecast, by Industry Vertical
8.3.6. Market Analysis, by Country
8.3.6.1. UK
8.3.6.1.1. Market Size and Forecast, by Product Type
8.3.6.1.2. Market Size and Forecast, by Technology
8.3.6.1.3. Market Size and Forecast, by Installation
8.3.6.1.4. Market Size and Forecast, by Industry Vertical
8.3.6.2. Germany
8.3.6.2.1. Market Size and Forecast, by Product Type
8.3.6.2.2. Market Size and Forecast, by Technology
8.3.6.2.3. Market Size and Forecast, by Installation
8.3.6.2.4. Market Size and Forecast, by Industry Vertical
8.3.6.3. France
8.3.6.3.1. Market Size and Forecast, by Product Type
8.3.6.3.2. Market Size and Forecast, by Technology
8.3.6.3.3. Market Size and Forecast, by Installation
8.3.6.3.4. Market Size and Forecast, by Industry Vertical
8.3.6.4. Rest of Europe
8.3.6.4.1. Market Size and Forecast, by Product Type
8.3.6.4.2. Market Size and Forecast, by Technology
8.3.6.4.3. Market Size and Forecast, by Installation
8.3.6.4.4. Market Size and Forecast, by Industry Vertical
8.4. Asia-Pacific
8.4.1. Key Market Trends, Growth Factors, and Opportunities
8.4.2. Market Size and Forecast, by Product Type
8.4.3. Market Size and Forecast, by Technology
8.4.4. Market Size and Forecast, by Installation
8.4.5. Market Size and Forecast, by Industry Vertical
8.4.6. Market Analysis, by Country
8.4.6.1. China
8.4.6.1.1. Market Size and Forecast, by Product Type
8.4.6.1.2. Market Size and Forecast, by Technology
8.4.6.1.3. Market Size and Forecast, by Installation
8.4.6.1.4. Market Size and Forecast, by Industry Vertical
8.4.6.2. Japan
8.4.6.2.1. Market Size and Forecast, by Product Type
8.4.6.2.2. Market Size and Forecast, by Technology
8.4.6.2.3. Market Size and Forecast, by Installation
8.4.6.2.4. Market Size and Forecast, by Industry Vertical
8.4.6.3. India
8.4.6.3.1. Market Size and Forecast, by Product Type
8.4.6.3.2. Market Size and Forecast, by Technology
8.4.6.3.3. Market Size and Forecast, by Installation
8.4.6.3.4. Market Size and Forecast, by Industry Vertical
8.4.6.4. Rest of Asia-Pacific
8.4.6.4.1. Market Size and Forecast, by Product Type
8.4.6.4.2. Market Size and Forecast, by Technology
8.4.6.4.3. Market Size and Forecast, by Installation
8.4.6.4.4. Market Size and Forecast, by Industry Vertical
8.5. LAMEA
8.5.1. Key Market Trends, Growth Factors, and Opportunities
8.5.2. Market Size and Forecast, by Product Type
8.5.3. Market Size and Forecast, by Technology
8.5.4. Market Size and Forecast, by Installation
8.5.5. Market Size and Forecast, by Industry Vertical
8.5.6. Market Analysis, by Country
8.5.6.1. Latin America
8.5.6.1.1. Market Size and Forecast, by Product Type
8.5.6.1.2. Market Size and Forecast, by Technology
8.5.6.1.3. Market Size and Forecast, by Installation
8.5.6.1.4. Market Size and Forecast, by Industry Vertical
8.5.6.2. Middle East
8.5.6.2.1. Market Size and Forecast, by Product Type
8.5.6.2.2. Market Size and Forecast, by Technology
8.5.6.2.3. Market Size and Forecast, by Installation
8.5.6.2.4. Market Size and Forecast, by Industry Vertical
8.5.6.3. Africa
8.5.6.3.1. Market Size and Forecast, by Product Type
8.5.6.3.2. Market Size and Forecast, by Technology
8.5.6.3.3. Market Size and Forecast, by Installation
8.5.6.3.4. Market Size and Forecast, by Industry Vertical
Chapter 9: Competitive Landscape
9.1. Introduction
9.1.1. Market Player Positioning, 2019
9.2. Product Mapping of Top 10 Player
9.3. Competitive Dashboard
9.4. Competitive Heatmap
Chapter 10: Company Profiles
10.1.3M
10.1.1. Company Overview
10.1.2. Key Executives
10.1.3. Company Snapshot
10.1.4. Operating Business Segments
10.1.5. Product Portfolio
10.1.1. R&D Expenditure
10.1.2. Business Performance
10.2. Behr Bircher Cellpack Bbc Ag
10.2.1. Company Overview
10.2.2. Key Executives
10.2.3. Company Snapshot
10.2.4. Operating Business Segments
10.2.5. Product Portfolio
10.3. Compaq International (P) Ltd.
10.3.1. Company Overview
10.3.2. Key Executives
10.3.3. Company Snapshot
10.3.4. Operating Business Segments
10.3.5. Product Portfolio
10.4. Nexans
10.4.1. Company Overview
10.4.2. Key Executives
10.4.3. Company Snapshot
10.4.4. Operating Business Segments
10.4.5. Product Portfolio
10.4.6. Business Performance
10.4.7. Key Strategic Moves and Developments
10.5. Nkt A/S
10.5.1. Company Overview
10.5.2. Key Executives
10.5.3. Company Snapshot
10.5.4. Operating Business Segments
10.5.5. Product Portfolio
10.5.6. R&D Expenditure
10.5.7. Business Performance
10.5.8. Key Strategic Moves and Developments
10.6. Phoenix Technology Group Co. Ltd
10.6.1. Company Overview
10.6.2. Key Executives
10.6.3. Company Snapshot
10.6.4. Operating Business Segments
10.6.5. Product Portfolio
10.7. Repl International
10.7.1. Company Overview
10.7.2. Key Executives
10.7.3. Company Snapshot
10.7.4. Operating Business Segments
10.7.5. Product Portfolio
10.7.6. Business Performance
10.8. Sumitomo Electric U.S. A., Inc.
10.8.1. Company Overview
10.8.2. Key Executives
10.8.3. Company Snapshot
10.8.4. Operating Business Segments
10.8.5. Product Portfolio
10.8.6. R&D Expenditure
10.8.7. Business Performance
10.9. Te Connectivity
10.9.1. Company Overview
10.9.2. Key Executives
10.9.3. Company Snapshot
10.9.4. Operating Business Segments
10.9.5. Product Portfolio
10.9.6. R&D Expenditure
10.9.7. Business Performance
10.10. Yamuna Infra & Technology Pvt. Ltd.
10.10.1. Company Overview
10.10.2. Key Executives
10.10.3. Company Snapshot
10.10.4. Operating Business Segments
10.10.5. Product Portfolio
List of Tables
Table 01. Medium Voltage Cable Accessories Market for Cable Joints & Splice, by Region, 2019-2027 ($Million)
Table 02. Medium Voltage Cable Accessories Market for Connectors, by Region 2019-2027 ($Million)
Table 03. Medium Voltage Cable Accessories Market for Terminations, by Region 2019-2027 ($Million)
Table 04. Medium Voltage Cable Accessories Market for Others, by Region 2019-2027 ($Million)
Table 05. Global Medium Voltage Cable Accessories Market, by Technology, 2019-2027($Million)
Table 06. Medium Voltage Cable Accessories Market for Heat Shrink, by Region 2019-2027 ($Million)
Table 07. Medium Voltage Cable Accessories Market for Cold Shrink, by Region 2019-2027 ($Million)
Table 08. Medium Voltage Cable Accessories Market for Pre-Molded Terminations, by Region 2019-2027 ($Million)
Table 09. Global Medium Voltage Cable Accessories Market, by Installation, 2019-2027($Million)
Table 10. Overhead Medium Voltage Cable Accessories Market, by Region 2019-2027 ($Million)
Table 11. Underground Medium Voltage Cable Accessories Market , by Region 2019-2027 ($Million)
Table 12. Submedium Voltage Cable Accessories Market for Marine , by Region 2019-2027 ($Million)
Table 13. Global Medium Voltage Cable Accessories Market, by Industry Vertical, 2019-2027($Million)
Table 14. Medium Voltage Cable Accessories Market for Railways, by Region 2019-2027 ($Million)
Table 15. Medium Voltage Cable Accessories Market for Construction, by Region 2019-2027 ($Million)
Table 16. Medium Voltage Cable Accessories Market for Private Utilities, by Region 2019-2027 ($Million)
Table 17. Medium Voltage Cable Accessories Market for Cement, by Region 2019-2027 ($Million)
Table 18. Medium Voltage Cable Accessories Market for Marine, by Region 2019-2027 ($Million)
Table 19. Medium Voltage Cable Accessories Market for Government Utilities, by Region 2019-2027 ($Million)
Table 20. Medium Voltage Cable Accessories Market for Oil & Gas, by Region 2019-2027 ($Million)
Table 21. Medium Voltage Cable Accessories Market for Healthcare, by Region 2019-2027 ($Million)
Table 22. Medium Voltage Cable Accessories Market for Fertilizer, by Region 2019-2027 ($Million)
Table 23. Medium Voltage Cable Accessories Market for Steel, by Region 2019-2027 ($Million)
Table 24. Medium Voltage Cable Accessories Market for Others, by Region 2019-2027 ($Million)
Table 25. Medium Voltage Cable Accessories Market Revenue, by Region, 2019-2027 ($Million)
Table 26. North America Medium Voltage Cable Accessories Market, by Product Type, 2019-2027 ($Million)
Table 27. North America Medium Voltage Cable Accessories Market, by Technology, 2019-2027 ($Million)
Table 28. North America Medium Voltage Cable Accessories Market, by Installation, 2019-2027 ($Million)
Table 29. North America Medium Voltage Cable Accessories Market, by Industry Vertical, 2019-2027 ($Million)
Table 30. U.S. Medium Voltage Cable Accessories Market, by Product Type, 2019-2027 ($Million)
Table 31. U.S. Medium Voltage Cable Accessories Market, by Technology, 2019-2027 ($Million)
Table 32. U.S. Medium Voltage Cable Accessories Market, by Installation, 2019-2027 ($Million)
Table 33. U.S. Medium Voltage Cable Accessories Market, by Industry Vertical, 2019-2027 ($Million)
Table 34. Canada Medium Voltage Cable Accessories Market, by Product Type, 2019-2027 ($Million)
Table 35. Canada Medium Voltage Cable Accessories Market, by Technology, 2019-2027 ($Million)
Table 36. U.S. Medium Voltage Cable Accessories Market, by Installation, 2019-2027 ($Million)
Table 37. Canada Medium Voltage Cable Accessories Market, by Industry Vertical, 2019-2027 ($Million)
Table 38. Mexico Medium Voltage Cable Accessories Market, by Product Type, 2019-2027 ($Million)
Table 39. Mexico Medium Voltage Cable Accessories Market, by Technology, 2019-2027 ($Million)
Table 40. U.S. Medium Voltage Cable Accessories Market, by Installation, 2019-2027 ($Million)
Table 41. Mexico Medium Voltage Cable Accessories Market, by Industry Vertical, 2019-2027 ($Million)
Table 42. Europe Medium Voltage Cable Accessories Market, by Product Type, 2019-2027 ($Million)
Table 43. Europe Medium Voltage Cable Accessories Market, by Technology, 2019-2027 ($Million)
Table 44. Europe Medium Voltage Cable Accessories Market, by Installation, 2019-2027 ($Million)
Table 45. Europe Medium Voltage Cable Accessories Market, by Industry Vertical, 2019-2027 ($Million)
Table 46. UK Medium Voltage Cable Accessories Market, by Product Type, 2019-2027 ($Million)
Table 47. UK Medium Voltage Cable Accessories Market, by Technology, 2019-2027 ($Million)
Table 48. UK Medium Voltage Cable Accessories Market, by Installation, 2019-2027 ($Million)
Table 49. UK Medium Voltage Cable Accessories Market, by Industry Vertical, 2019-2027 ($Million)
Table 50. Germany Medium Voltage Cable Accessories Market, by Product Type, 2019-2027 ($Million)
Table 51. Germany Medium Voltage Cable Accessories Market, by Technology, 2019-2027 ($Million)
Table 52. Germany Medium Voltage Cable Accessories Market, by Installation, 2019-2027 ($Million)
Table 53. Germany Medium Voltage Cable Accessories Market, by Industry Vertical, 2019-2027 ($Million)
Table 54. France Medium Voltage Cable Accessories Market, by Product Type, 2019-2027 ($Million)
Table 55. France Medium Voltage Cable Accessories Market, by Technology, 2019-2027 ($Million)
Table 56. France Medium Voltage Cable Accessories Market, by Installation, 2019-2027 ($Million)
Table 57. France Medium Voltage Cable Accessories Market, by Industry Vertical, 2019-2027 ($Million)
Table 58. Rest of Europe Medium Voltage Cable Accessories Market, by Product Type, 2019-2027 ($Million)
Table 59. Rest of Europe Medium Voltage Cable Accessories Market, by Technology, 2019-2027 ($Million)
Table 60. Rest of Europe Medium Voltage Cable Accessories Market, by Installation, 2019-2027 ($Million)
Table 61. Rest of Europe Medium Voltage Cable Accessories Market, by Industry Vertical, 2019-2027 ($Million)
Table 62. Asia-Pacific Medium Voltage Cable Accessories Market, by Product Type, 2019-2027 ($Million)
Table 63. Asia-Pacific Medium Voltage Cable Accessories Market, by Technology, 2019-2027 ($Million)
Table 64. Asia-Pacific Medium Voltage Cable Accessories Market, by Installation, 2019-2027 ($Million)
Table 65. Asia-Pacific Medium Voltage Cable Accessories Market, by Industry Vertical, 2019-2027 ($Million)
Table 66. China Medium Voltage Cable Accessories Market, by Product Type, 2019-2027 ($Million)
Table 67. China Medium Voltage Cable Accessories Market, by Technology, 2019-2027 ($Million)
Table 68. China Medium Voltage Cable Accessories Market, by Installation, 2019-2027 ($Million)
Table 69. China Medium Voltage Cable Accessories Market, by Industry Vertical, 2019-2027 ($Million)
Table 70. Japan Medium Voltage Cable Accessories Market, by Product Type, 2019-2027 ($Million)
Table 71. Japan Medium Voltage Cable Accessories Market, by Technology, 2019-2027 ($Million)
Table 72. Japan Medium Voltage Cable Accessories Market, by Installation, 2019-2027 ($Million)
Table 73. Japan Medium Voltage Cable Accessories Market, by Industry Vertical, 2019-2027 ($Million)
Table 74. India Medium Voltage Cable Accessories Market, by Product Type, 2019-2027 ($Million)
Table 75. India Medium Voltage Cable Accessories Market, by Technology, 2019-2027 ($Million)
Table 76. India Medium Voltage Cable Accessories Market, by Installation, 2019-2027 ($Million)
Table 77. India Medium Voltage Cable Accessories Market, by Industry Vertical, 2019-2027 ($Million)
Table 78. Rest of Asia-Pacific Medium Voltage Cable Accessories Market, by Product Type, 2019-2027 ($Million)
Table 79. Rest of Asia-Pacific Medium Voltage Cable Accessories Market, by Technology, 2019-2027 ($Million)
Table 80. Rest of Asia-Pacific Medium Voltage Cable Accessories Market, by Installation, 2019-2027 ($Million)
Table 81. Rest of Asia-Pacific Medium Voltage Cable Accessories Market, by Industry Vertical, 2019-2027 ($Million)
Table 82. LAMEA Medium Voltage Cable Accessories Market, by Product Type, 2019-2027 ($Million)
Table 83. LAMEA Medium Voltage Cable Accessories Market, by Technology, 2019-2027 ($Million)
Table 84. LAMEA Medium Voltage Cable Accessories Market, by Installation, 2019-2027 ($Million)
Table 85. LAMEA Medium Voltage Cable Accessories Market, by Industry Vertical, 2019-2027 ($Million)
Table 86. Latin America Medium Voltage Cable Accessories Market, by Product Type, 2019-2027 ($Million)
Table 87. Latin America Medium Voltage Cable Accessories Market, by Technology, 2019-2027 ($Million)
Table 88. Latin America Medium Voltage Cable Accessories Market, by Installation, 2019-2027 ($Million)
Table 89. Latin America Medium Voltage Cable Accessories Market, by Industry Vertical, 2019-2027 ($Million)
Table 90. Middle East Medium Voltage Cable Accessories Market, by Product Type, 2019-2027 ($Million)
Table 91. Middle East Medium Voltage Cable Accessories Market, by Technology, 2019-2027 ($Million)
Table 92. Middle East Medium Voltage Cable Accessories Market, by Installation, 2019-2027 ($Million)
Table 93. Middle East Medium Voltage Cable Accessories Market, by Industry Vertical, 2019-2027 ($Million)
Table 94. Africa Medium Voltage Cable Accessories Market, by Product Type, 2019-2027 ($Million)
Table 95. Africa Medium Voltage Cable Accessories Market, by Technology, 2019-2027 ($Million)
Table 96. Africa Medium Voltage Cable Accessories Market, by Installation, 2019-2027 ($Million)
Table 97. Africa Medium Voltage Cable Accessories Market, by Industry Vertical, 2019-2027 ($Million)
Table 98. Key Executives
Table 99. 3M: Company Snapshot
Table 100. 3M: Operating Segments
Table 101. 3M: Product Portfolio
Table 102. Key Executives
Table 103. Behr Bircher Cellpack Bbc Ag: Company Snapshot
Table 104. Behr Bircher Cellpack Bbc Ag: Operating Segments
Table 105. Behr Bircher Cellpack Bbc Ag: Product Portfolio
Table 106. Key Executives
Table 107. Compaq International: Company Snapshot
Table 108. Compaq International: Operating Segments
Table 109. Compaq International: Product Portfolio
Table 110. Key Executives
Table 111. Nexans: Company Snapshot
Table 112. Nexans: Operating Segments
Table 113. Nexans: Product Portfolio
Table 114. Key Executives
Table 115. Nkt A/S: Company Snapshot
Table 116. Nkt A/S: Operating Segments
Table 117. Nkt A/S: Product Portfolio
Table 118. Key Executives
Table 119. Phoenix Technology: Company Snapshot
Table 120. Phoenix Technology: Operating Segments
Table 121. Phoenix Technolog: Product Portfolio
Table 122. Key Executives
Table 123. Repl International: Company Snapshot
Table 124. Repl International: Operating Segments
Table 125. Repl International: Product Portfolio
Table 126. Key Executives
Table 127. Sumitomo Electric: Company Snapshot
Table 128. Sumitomo Electric: Operating Segments
Table 129. Sumitomo Electric: Product Portfolio
Table 130. Key Executives
Table 131. Te Connectivity: Company Snapshot
Table 132. Te Connectivity: Operating Segments
Table 133. Te Connectivity: Product Portfolio
Table 134. Key Executives
Table 135. Yamuna Info & Technology: Company Snapshot
Table 136. Yamuna Info& Technology: Operating Segments
Table 137. Yamuna Info & Technology: Product Portfolio
List of Figures
Figure 01. Key Market Segments
Figure 02. Executive Summary, by Segmentation
Figure 03. Executive Summary, by Region
Figure 04. Top Impacting Factors
Figure 05. Top Investment Pockets
Figure 06. Moderate Bargaining Power of Suppliers
Figure 07. Moderate Threat of New Entrants
Figure 08. Moderate Threat of Substitutes
Figure 09. Moderate Intensity of Rivalry
Figure 10. Low to Moderate Bargaining Power of Buyers
Figure 11. Global Medium Voltage Cable Accessories Market Share, by Product Type, 2019-2027 (%)
Figure 12. Global Medium Voltage Cable Accessories Market, by Product Type, 2019-2027 ($Million)
Figure 13. Comparative Share Analysis Medium Voltage Cable Accessories Market for Cable Joints & Splice, by Country, 2019 & 2027 (%)
Figure 14. Comparative Share Analysis Medium Voltage Cable Accessories Market for Connectors, by Country, 2019 & 2027 (%)
Figure 15. Comparative Share Analysis Medium Voltage Cable Accessories Market for Terminations, by Country, 2019 & 2027 (%)
Figure 16. Comparative Share Analysis Medium Voltage Cable Accessories Market for Others, by Country, 2019 & 2027 (%)
Figure 17. Global Medium Voltage Cable Accessories Market Share, by Technology, 2019-2027 (%)
Figure 18. Comparative Share Analysis of Medium Voltage Cable Accessories Market for Heat Shrink, by Country, 2019 & 2027 (%)
Figure 19. Comparative Share Analysis of Medium Voltage Cable Accessories Market for Cold Shrink, by Country, 2019 & 2027 (%)
Figure 20. Comparative Share Analysis of Medium Voltage Cable Accessories Market for Pre-Molded Terminations, by Country, 2019 & 2027 (%)
Figure 21. Global Medium Voltage Cable Accessories Market Share, by Installation, 2019-2027 (%)
Figure 22. Comparative Share Analysis of Overhead Medium Voltage Cable Accessories Market, by Country, 2019 & 2027 (%)
Figure 23. Comparative Share Analysis of Underground Medium Voltage Cable Accessories Market, by Country, 2019 & 2027 (%)
Figure 24. Comparative Share Analysis of Submedium Voltage Cable Accessories Market for Marine , by Country, 2019 & 2027 (%)
Figure 25. Global Medium Voltage Cable Accessories Market Share, by Industry Vertical, 2019-2027 (%)
Figure 26. Comparative Share Analysis of Medium Voltage Cable Accessories Market for Railways, by Country, 2019 & 2027 (%)
Figure 27. Comparative Share Analysis of Medium Voltage Cable Accessories Market for Construction, by Country, 2019 & 2027 (%)
Figure 28. Comparative Share Analysis of Medium Voltage Cable Accessories Market for Private Utilities, by Country, 2019 & 2027 (%)
Figure 29. Comparative Share Analysis of Medium Voltage Cable Accessories Market for Cement, by Country, 2019 & 2027 (%)
Figure 30. Comparative Share Analysis of Medium Voltage Cable Accessories Market for Marine, by Country, 2019 & 2027 (%)
Figure 31. Comparative Share Analysis of Medium Voltage Cable Accessories Market for Government Utilities, by Country, 2019 & 2027 (%)
Figure 32. Comparative Share Analysis of Medium Voltage Cable Accessories Market for Oil & Gas, by Country, 2019 & 2027 (%)
Figure 33. Comparative Share Analysis of Medium Voltage Cable Accessories Market for Healthcare, by Country, 2019 & 2027 (%)
Figure 34. Comparative Share Analysis of Medium Voltage Cable Accessories Market for Fertilizer, by Country, 2019 & 2027 (%)
Figure 35. Comparative Share Analysis of Medium Voltage Cable Accessories Market for Steel, by Country, 2019 & 2027 (%)
Figure 36. Comparative Share Analysis of Medium Voltage Cable Accessories Market for Others, by Country, 2019 & 2027 (%)
Figure 37. Medium Voltage Cable Accessories Market, by Region, 2019-2027 (%)
Figure 38. Comparative Share Analysis of North America Medium Voltage Cable Accessories Market, by Country, 2019-2027 (%)
Figure 39. U.S. Medium Voltage Cable Accessories Market, 2019-2027 ($Million)
Figure 40. Canada Medium Voltage Cable Accessories Market, 2019-2027 ($Million)
Figure 41. Mexico Medium Voltage Cable Accessories Market, 2019-2027 ($Million)
Figure 42. Comparative Share Analysis of Europe Medium Voltage Cable Accessories Market, by Country, 2019-2027 (%)
Figure 43. UK Medium Voltage Cable Accessories Market, 2019-2027 ($Million)
Figure 44. Germany Medium Voltage Cable Accessories Market, 2019-2027 ($Million)
Figure 45. France Medium Voltage Cable Accessories Market, 2019-2027 ($Million)
Figure 46. Rest of Europe Medium Voltage Cable Accessories Market, 2019-2027 ($Million)
Figure 47. Comparative Share Analysis of Asia-Pacific Medium Voltage Cable Accessories Market, by Country, 2019-2027 (%)
Figure 48. China Medium Voltage Cable Accessories Market, 2019-2027 ($Million)
Figure 49. Japan Medium Voltage Cable Accessories Market, 2019-2027 ($Million)
Figure 50. India Medium Voltage Cable Accessories Market, 2019-2027 ($Million)
Figure 51. Rest of Asia-Pacific Medium Voltage Cable Accessories Market, 2019-2027 ($Million)
Figure 52. Comparative Share Analysis of LAMEA Medium Voltage Cable Accessories Market, by Country, 2019-2027 (%)
Figure 53. Latin America Medium Voltage Cable Accessories Market, 2019-2027 ($Million)
Figure 54. Middle East Medium Voltage Cable Accessories Market, 2019-2027 ($Million)
Figure 55. Africa Medium Voltage Cable Accessories Market, 2019-2027 ($Million)
Figure 56. Market Player Positioning, 2019
Figure 57. Product Mapping of Top 10 Players
Figure 58. Competitive Dashboard
Figure 59. Competitive Heatmap of Key Players
Figure 60.3M Connectivity, 2018-2020 ($Million)
Figure 61.3M: Revenue, 2018-2020 ($Million)
Figure 62.3M: Revenue Share by Segment, 2020 (%)
Figure 63.3M: Revenue Share by Region, 2020 (%)
Figure 64. Nexans: Revenue, 2018-2020 ($Million)
Figure 65. Nexans: Revenue Share by Segment, 2020 (%)
Figure 66. Nexans: Revenue Share by Region, 2020 (%)
Figure 67. Nkt A/S, 2018-2020 ($Million)
Figure 68. Nkt A/S: Revenue, 2018-2020 ($Million)
Figure 69. Nkt A/S: Revenue Share by Region, 2020 (%)
Figure 70. Repl International: Revenue, 2018-2020 ($Million)
Figure 71. Sumitomo Electric, 2018-2020 ($Million)
Figure 72. Sumitomo Electric: Revenue, 2018-2020 ($Million)
Figure 73. Sumitomo Electric: Revenue Share by Segment, 2020 (%)
Figure 74. Sumitomo Electric: Revenue Share by Region, 2020 (%)
Figure 75. Te Connectivity, 2018-2020 ($Million)
Figure 76. Te Connectivity: Revenue, 2018-2020 ($Million)
Figure 77. Te Connectivity: Revenue Share by Segment, 2020 (%)
Figure 78. Te Connectivity: Revenue Share by Region, 2020 (%)
")
Purchase Report Here
About Research & Markets

Research and Markets was founded in 2002 with one simple aim; to connect businesses with the market insights and analysis they need to enable intelligent decision-making. Since then we have grown into the world’s largest market research store with clients all over the world, including 450+ of the Fortune 500 Clients, choosing to buy their research from us.
Headquartered beside the Guinness Brewery in Dublin Ireland, Research and Markets offers insight into over 800 industries from Automotive to Telecommunications to Zoology and (almost) everything in between!
At Research and Markets, we understand that the research we provide is only as good as the outcome it inspires. That’s why we are proud to provide the widest range of research products, multilingual 24/7 customer support and dedicated custom research services to deliver the insights you need to achieve your goals.

THORNE & DERRICK
T&D are Specialist Distributors to UK Distribution Network Operators (DNO’s), NERS Registered Service Providers, ICP’s and HV Jointing Contractors of an extensive range of LV, MV & HV Jointing, Earthing, Substation & Electrical Equipment – this includes 11kV/33kV/66kV joints, terminations and connectors for both DNO and private network applications.
Contact our UK Power Team for competitive quotations, fast delivery from stock and technical support or training on all LV-HV products.
Key Product Categories: Duct Seals | Cable Cleats | Cable Glands | Electrical Safety | Arc Flash Protection | Cable Jointing Tools | Cable Pulling | Earthing | Feeder Pillars | Cable Joints LV | Joints & Terminations MV HV
Cable Testing – Is Resonance Testing The Way Forward For Offshore Wind?
June 15th, 2021
-
Reproduced with kind permission of Calum Galvin from Mane - Worldwide Recruitment Specialists
Offshore Wind
Cable Testing of Medium Voltage Power Systems & Accessories
Imagine this: Right before the winter season, something goes wrong at an offshore wind farm. There’s a fault somewhere in one of the long submarine cables that carry the generated electricity to land.
But with storms raging and the testing season almost over, nobody can get out there to run a high-voltage test on the cables. There’ll be no way to find the fault until at least April – which means no electricity. The turbines spin all winter for nothing, while the power company bleeds money.
Conventional cable testing systems aren’t designed to be used in the middle of the ocean.
Salty air, rain, snow, and stormy seas make it impossible to operate them reliably. And you can’t exactly pitch a tent over them. Then there’s the difficulty of getting people to the site to carry out the tests. It’s only possible for a few months of the year, and even then it takes considerable advance planning.
This means offshore wind companies have resigned themselves to the use of SOAK tests (a 24-hour test with only nominal voltage) to test cables. But with cables getting longer, and often being made without joints, these tests are becoming increasingly inadequate. Practical and weatherproof testing systems for offshore cables are urgently needed.
Offshore wind is the leading form of renewable energy, and wind turbines are constantly increasing in power. For new wind farms, the operating voltage of the submarine cables that deliver the electricity is being increased to 66kV.
The International Electrotechnical Commission (IEC) has therefore greenlit a second form of testing for operating voltages over 36kV: resonance testing.
Rather than using nominal voltage like the SOAK test, resonance testing actually reproduces the load on a cable operating normally at normal voltage and grid frequency. The test is carried out using a resonant circuit made up of a test inductor (inductance) and a test cable (capacitance). The test system supply has a variable frequency which is automatically set to the test circuit’s resonance frequency, minimising the feed-in power needed.
Resonance testing can also reliably detect installation errors – which are the cause of over half of all problems on offshore wind farms.
The resonance testing system offers wind farm operators, testing service providers, cable manufacturers the flexibility they need to keep complex offshore wind infrastructure functioning continuously, all year round.
And if something does go wrong just before the end of the testing season, resonance testing will enable them to quickly test the systems, fix the problem and keep the winter wind generating power.
- More By Mane Contract Services – Why Large Offshore Wind Farms Should Double Their Intra-Array Voltage


See how Thorne & Derrick support, supply and service the Renewable Energy industry.
Insight
by Ross Piercey | Asset Manager at JDR Cable Systems
Insurers want confidence in power systems – the weakest part of the inter array system is the cable accessories. The resource pool for Competent Jointers is shrinking due to high demand meaning quality of Jointing & Terminating workmanship can fluctuate.
The conditions they are fitted in are not that of labs.
Given over 50% of failures are cable accessories, a PD monitored, resonance test at power frequency does give early indications of potentially critical issues with cable preparation.
Furthermore, understanding PD inception voltages when testing at power frequency gives a much better indication of a “hard working” array cable. Resonance may practically be an issue, but we are an industry and business who thrives on a challenge. The Carbon Trust and others are looking at testing options and this issue needs addressing at an industry level, the cost of failure, dictates we must.
VLF /DAC are great tools but some feel they do not excite failure modes enough to be picked up but PD analysis is helping this, but offshore this is not without its issues. JDR are already bidding resonance for numerous clients, before the year is out we will resonance test with a state of the art purpose built system offshore, watch this space.

Global energy companies depend on high performance subsea umbilicals and cables to provide power and control in the world’s harshest offshore environments. JDR is a leading provider of technology connecting the global offshore energy industry.

Thorne & Derrick are Specialist Distributors to the UK and international Offshore Wind & Renewable industry to provide safe and reliable LV HV Electrical Cable & Power Distribution Systems up to 66kV – we are highly customer responsive and absolutely committed to providing a world-class service.
Contact our UK Power Team for competitive quotations, fast delivery from stock and technical support or training on all LV-HV products.
Key Product Categories: Duct Seals | Cable Cleats | Cable Glands | Electrical Safety | Arc Flash Protection | Cable Jointing Tools | Cable Pulling | Earthing | Feeder Pillars | Cable Joints LV | Joints & Terminations MV HV
Understanding Battery Energy Storage Systems (BESS) and Power Arbitrage By SPE Electrical Ltd
June 15th, 2021
 and Power Arbitrage By SPE Electrical Ltd")
This article has been republished with the kind permission of SPE Electrical Ltd.
SPE Electrical Ltd
SPE Electrical are based in Dorset, in the South West, but serve the whole of the UK as well as many international clients.
The company was created in early 2006, in recognition of the rapidly expanding infrastructure and energy sectors, and the associated need for specialist HV consultancy services. To date their power system consultants have undertaken a wide range of studies for a variety of local, national and international clients.
The company specialise in all aspects of design, analysis and consultancy that relate to large power system and have design experience from low voltage to 400kV, and covers industries as diverse as renewable power to water treatment plants. SPE Electrical Ltd are also well versed in international design standards and practices such as IEC, ANSI, IEEE, NEC and NFPA, and their engineers have worked on projects all around the globe.
Battery Energy Storage Systems – Power Arbitrage
Part 1: Introduction
Battery Energy Storage Schemes are very versatile plants and can be used for a number of different services, depending on the plant design and aims; this can include services such as power arbitrage, voltage control, and the new Dynamic Containment (DC) service which replaces the old Enhanced Frequency Response (EFR) service. BESS units can also be used as a power balancing service, to meet shortfalls in power, to limit disturbances from the grid during transient switching events, where a plant has large dynamics loads, such as big motors and generators that switch in and out frequently.
At SPE we have found that many developers are keen to add battery storage systems into their existing projects, but are often unsure exactly how the battery will be used. This leads to the dilemma of trying to design a system that will be flexible enough to allow future revenue streams, without pre-investing for expensive system upgrades.
This first post gives a simple guide to explain the basic ideas of how a BESS works and looks at their role in providing power arbitrage.
Part 2: BESS Basics
Before we get into the specifics, it is worth covering a couple of basic ideas of what a BESS is and how it operates. First off, the term BESS is generic name for an electronic Power Conversion System (PCS) i.e. inverter, coupled with some form of battery. From the DNO and TSO perspective the battery doesn’t actually matter too much, and it is the PCS that is really of interest.
The battery can be anything from old car batteries, to modern li-Ion batteries, or more advanced cryo-batteries or flow batteries.
The battery type just determines how much energy can be stored and how quickly it can be converted from chemical form to electrical energy.
Second, a simple concept that is often misunderstood is the difference between power (MW) and energy (MWh). A BESS rated at 1MW & 1MWh can provide 1MW for an hour, of 0.5MW for 2 hours, or 0.25MW for 4 hours etc. but it can never provide more than 1MW, because this limit is imposed by the inverter rating and system design. From the DNO perspective the amount of MW is important, as this governs the main power flows in their network.
This leads to our third point, which is that of power swings. Simple MW flow is easy to understand from DNOs heat maps, but the ability of the DNO network to cope with large power swings is much less clear and usually needs some analysis.
For power swing, we are referring to the speed at which the BESS needs to change from import to export and vice versa. For power arbitrage this is very slow and doesn’t cause a significant power swing, but for fast response services like DC, the power swing can be significant with a 50MW BESS, potentially going from full export to full import in 1s, giving a 100MW/s power swing – which would challenge the most robust of power systems. This is why the G99 forms ask for the ramp rate of the BESS. This is bit of a tricky area, and often a major constraint, which we will go through in another post.
Our third point is that a BESS can provide reactive power as well as providing active power, and importantly it can provide reactive power at the same time, which is useful for regulating voltage on the DNO network. Provided the BESS is correctly sized, it could easily provide 20MW of active power and 20MVAr of reactive power.
So, when preparing a grid application for a BESS it is important to understand what services we are hoping to provide to the system and what the local limitations are.
The DNO or National Grid, typically want to know the MW capacity of the site, and the worst-case power swing as well as any reactive power flow capability, as these are what will affect their system behaviour and responses, but are not usually that interested in the MWh rating of the system.
Part 3: Power Arbitrage
The power arbitrage service of a BESS is technically and commercially the simplest concept for battery storage. It is based on the simple premise of absorbing energy when it power is cheap, such as at night or when there is excess power from CHP or solar array, and then discharging the battery during peak load times. The benefit of such an approach allows what is known as load demand curve shifting, where the excess power from renewables (often solar) is stored at high production times / low demand then discharged at low production times / peak demand.
This has two main benefits. Firstly, and depending on the profile, high tariff electricity costs can be avoided, and a flat charging profile created. Secondly, it means that the size of the grid connection can potentially be reduced, although one needs to consider what happens if there was a shortfall in the surplus power i.e. a very cloud day, if the surplus comes from a Solar PV array.
The revenue streams here are obviously limited to the cost of energy creation and storage at cheap times, compared to the cost of energy during high tariff times, and is based on the concept of peak shifting the energy demand, so that it is balanced more evenly across a 24 hour (or whatever other timeframe). In the authors opinion, this is the ‘holy grail’ of most BESS units and The System Operators (TSO), an electrical system demand that is predictable, and therefore easy to plant and dispatch. In practice to achieve, this the BESS has to be cheap and robust enough to store and dispatch energy as needed, and when is most economic to do so.

Figure 1: Diagram Showing Power Arbitrage Concept
With power arbitrage, the charge and discharge of the BESS is usually very slow, and this will not overly stress the host electrical system or the DNO system. From a design point of view, compliance with the ENA P28/2 standard is not usually an issue, but a large battery systems can contribute significantly to the system harmonics and voltage flicker due to the power electronics operation, which usually needs some careful analysis to ensure compliance.
A less obvious use of a BESS is using it as a power store to support starting and operation of a heavy consumer of power. Let us say for example you have a heavy industrial plant that you want to add a new 10MW motor to. Starting these motors is always a complex process, but fortunately ones that a Variable Speed Drive solves easily, but what happens if your grid supply to the DNO is maxed out and an upgrade will cost millions. Simple(ish), you install a BESS and charge it up overnight, then discharge it when the new drive needs to operate. The DNO does not see any additional power demand and no network upgrades are needed.
Part 4: Applications – Power Arbitrage & Balancing in a Water Treatment Works (WTW)
For an application example, let us consider an example of a Water Treatment Works (WTW) that is hoping to achieve carbon neutral status within the next 5 years. WTW sites are interesting ones to study, as they tend to have a mix of large varying loads such as pumps and compressors, and plenty of space to install Solar PV and a BESS and carry out the tie-ins between the new and existing plant. It should be noted that for our analysis, the site type doesn’t really matter as the principles are the same.
So how does power arbitrage work with a battery storage system work? This is best understood with an example. First, we start with the basic premise, that the plant owner has assessed their DNO connection and there are no problem and second that site has enough space to install a fair sized Solar PV array of 5-10 MW. Next, we look at the site power consumption, this is usually very dynamic, but lets pretend for a moment, that we can simplify things a bit and say they have an average steady state consumption during the day of 2MW, and at night-time it drops to 0.5MW. Our basic specification might look something like this:
- Space to install 5-10MW Solar PV array.
- Available HV point for tie-in.
- Desire to achieve full carbon neutral operation.
- Site load profile is simplified to a consistent value of:
- 2 MW approximately constant load between 8am and 7pm (11 hours) = 22MWh
- 5MW constant load between 7pm and 8 am (13 hours) = 6.5MWh
Simple deployment of a solar PV scheme would certainly help the asset owner, as the power produced by the Solar PV would offset the power consumption of the WTW by a significant margin. However, the problem would be that either the Solar PV would be oversized and during peak daylight hours would be exporting power, or it would be undersized, and not fully offset the power demand, and in both cases the night-time power demand would still be needed. This presents a dilemma for the asset owner, as neither scheme meets the objectives, but by adding a BESS into the mix, we can possible meet all the target goals.
Next, let’s do bit of basic maths to see what works, to calculate average any usage, energy storage capacity and so on. This can be done in a number of ways, depending on the level of sophistication desired, at the most basic, a simple Excel and graphical model can be generated of the load and generation profiles, but it is relatively easy to create more advanced mathematical models of the system, using various integration methods and piecewise linear functions, or directly in simulation package like Matlab. For the purpose of this post we will go for an easy Excel approach.
In the below diagram we can see a simplified power generation diagram shown in block format for the power generation (green), power demand (red), excess PV discharged into the BESS (blue) and power discharged from the BESS (yellow).

Figure 2: Simplified Block Diagram Showing Power Arbitrage Calculation
From the above plots we can see that we get a pretty good power balance, with around 2MWh spare capacity from the Solar PV system, which we can account for with intermittency, shading and other losses. We do can do some more simple maths and we can roughly dimension our PCS and battery size, as follows:
- The solar PV is sized to give a peak output of 5MWac.
- The battery PCS size has to be equal to the largest difference between the plant demand and the solar output. This occurs in the evening when power demand is still high and the solar output has fallen to near zero . I.e so the delta is 1 MW.
- We can see from the above that we need the BESS to be able to deliver 10.5 MWh.
- Our final design is therefore a 5 MW PV array coupled with a 1 MW BESS with a 10.5 MWh energy store.
Part 5: Summary – Power Arbitrage
The above is obviously very simple analysis, representing a simple Solar PV curve, and not accounting for probability and differing irradiance levels during the day and seasons. Likewise, the load is likely to significantly more variable than the simplified model shown. The thing to remember here, is that the post just shows a simple model for demonstration purposes, to show a principle of how a system could be made to work.
In practice, it is usually not economic to design a Solar PV and BESS system that achieves full carbon offset, because of the inherent probabilistic values in the irradiance levels. However, with some careful analysis and a bit of time, a Solar PV and BESS can go along way to meeting this target. The above example is for a WTW but would work just as well, for a large factory, or country estate. Of course, adding in a BESS to a brownfield site is never quite that simple, so it is usually necessary to carry out some surveys, and identify if the equipment is suitably rated for the increased duty and then identify the necessary tie in location.
It should also of course be noted that we have considered Solar PV and a battery storage solution here, but the principle applies to any intermittent renewable, such as wind power or wave power and any other storage technology, such as hydro, compressed air / gas etc. One final thing we can do with the new system, is to run the Solar and BESS at a slightly lagging power factor (producing MVArs) so the site is held at unity PF and even greater savings are achieved. If you would like to discuss your project requirements, please get in touch.
THORNE & DERRICK
Thorne & Derrick are national distributors of LV, MV & HV Cable Installation, Jointing, Substation & Electrical Equipment – servicing businesses involved in cabling, jointing, substation, earthing, overhead line and electrical construction at LV, 11kV, 33kV, 66kV and EHV. Supplying a complete range of power cable accessories to support the installation and maintenance of low/medium and high voltage power systems:
- Slip-on Cable Terminations
- Cold-shrink Cable Terminations
- Heat-shrink Cable Terminations
- Cable Joints – Heat & Cold-shrink
- Separable Connectors (Euromold)
- Surge Arresters & Switchgear/Transformer Bushings
Key Product Categories: Duct Seals | Cable Cleats | Cable Glands | Electrical Safety | Arc Flash Protection | Cable Jointing Tools | Cable Pulling | Earthing | Feeder Pillars | Cable Joints LV | Joints & Terminations MV HV

Earth Bars | High Specification Copper Earth Bars for Lightning Protection Systems
June 15th, 2021
Manufactured by AN Wallis | Distributed by Thorne & Derrick
Earth Bars
-
uploaded by Chris Dodds | Thorne & Derrick Sales + Marketing Manager
Copper Earth Bars for Lightning Protection Systems
Earth bars are an integral part of an Electrical oBuilding Services or Substation technical specification for earthing and bonding; they provide a convenient common earth point for the infrastructure. It is critical copper earth bars provide long lasting, high quality earthing capable of enduring any potential dangerous fault currents.
Main earthing bars provide a recognised earth connection/ reference point and allow the local substation earth resistance to be measured using a clamp meter.
Thorne & Derrick and AN Wallis are aware of the crucial role of an Earth Bar which is why they manufacture high quality, affordable earth bars that are designed and tested to all relevant standards – manufactured from hard drawn copper bar to BS EN 13601 and tested to BS EN 62561-1 Class H.
- Earthing bars can be tinned and bases powder coated to improve corrosion resistance
- Bars are pre-drilled with cable connection holes with optional threads for installation ease
- Manufactured from highest conductivity and quality copper to British Standards
- Full range of standard, single and twin link types for LV, MV & HV switchroom/substations
- Customised to suit the earthing requirements of your project on short lead times
Customer Service
From Earthing Schematic to Earth Bar Drawing to Custom Manufactured Product.
Thorne & Derrick, UK Distributor for AN Wallis, can produce Earth Bar drawings directly from your Earthing schematic, this gives our customers a clear visual representation of the product that we can offer. This drawing can be approved (or amended) by the customer prior to us beginning the manufacturing process. This unique service ensures that the product quoted is the correct product and specification required by the customer avoiding any confusion or potential delays prior to manufacturing.
Thorne & Derrick distribute an extensive range of standard and customised special earth bars – here are the basic specification and selection factors:
- Type – Standard | Single | Twin | Multiple Links
- Termination Configuration – i.e. 1 Way + Link + 6 Way + Link + 3 Way
- Copper Bar Sizes – 50mm x 6mm Standard | or Custom Specification
- Copper Bar Finish – Bare (Standard) or Tinned Copper
- Cable Lug Termination Size – M6 | M8 | M10 Standard | M12 | Other
- Termination Material – Phosphor Bronze (Standard) | Brass | Stainless Steel
- Termination Spacings – 50mm Standard | Custom Specification
- Length Restrictions – Yes | No | Specify
- Base Material – PVC Standard | AVG Galvanised Steel | None
You can contact us with your enquiry.

Customised Earth Bars
➡ Some recent examples of custom manufactured products to client specifications.
| 6 Way + Link + 1 Way Tinned Copper Earth Bar, Stainless Steel Bolts, Mounted on Insulators & Black PVC Base. |  |
| 6 Way + Link + 1 Way Plain Copper Earth Bar, Brass Bolts, Mounted on Insulators & AVG Galv. Steel Base. |  |
| 6 Way + Link Plain Copper Earth Bar, Phosphor Bronze Bolts, Mounted on Insulators & Black PVC Base. |  |
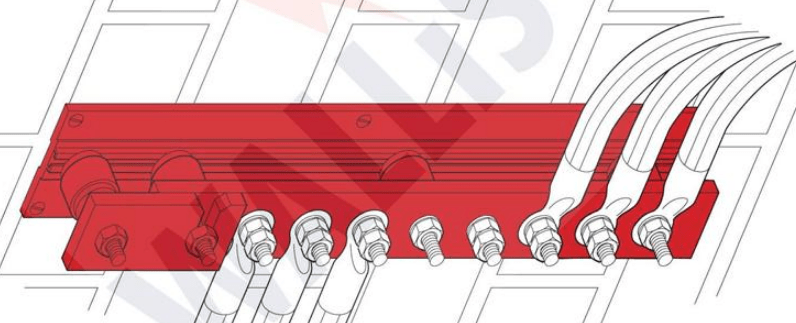
| 16 Way + Link + 2 Way Plain Copper Earth Bar, Brass Bolts, Mounted on Insulators & AVG Galv. Steel Base. |  |
| Telecommunications Earth Bar. |  |
| 24 Way Special Earth Bar (2 Rows of 12 No. for Double Holed Lugs), 100x6mm Plain Copper Bar, M10 Brass Bolts, Mounted on Insulators & AVG Galv. Steel Base. | , 100x6mm Plain Copper Bar, M10 Brass Bolts, Mounted on Insulators & AVG Galv. Steel Base.") |
| 10 Hole Earth Bar, 50x6mm Plain Copper Bar, No Bolts, Mounted on Insulators & AVG Galv. Steel Base Feet. |  |
| 5 Way + Link + 3 Way Earth Bar, 50x6mm Plain Copper Bar, M10 Phosphor Bronze Bolts, Mounted on Insulators & Black PVC Base. |  |
| 1 Way + Link + 1 Way Tinned Earth Bar, 50x6mm Tinned Copper Bar, M10 Brass Bolts, Mounted on Insulators & AVG Galv. Steel Base. |  |

1. 20 Way Staggered Earth Bar, 50x6mm Plain Copper Bar, M6 Phosphor Bronze Bolts, Mounted on Insulators & Black PVC Base. 2. 16 Way Staggered Earth Bar, 50x6mm Plain Copper Bar, M6 Phosphor Bronze Bolts, Mounted on Insulators & Black PVC Base. 3. 10 Way Earth Bar, 50x6mm Plain Copper Bar, M6 Phosphor Bronze Bolts, Mounted on Insulators & Black PVC Base.

10 Way + Link + 1 Way Earth Bar, 25x3mm Plain Copper Bar, M10 Phosphor Bronze Bolts, Mounted on Insulators & Black PVC Base
Copper Earth Bar Features
50mm Centres
- Standard 50mm hole centres will accommodate most earthing cable sizes
- Earth bar can be manufactured with different size hole centres
BS EN 62561-1 Class H
- Tested to BS EN 62561-1: Lightning Protection System Components (LPSC) – Part 1: Requirements for connection components
- Class H – Heavy Duty
Rounded Copper Edges
- Safer
- Easier to handle
- No sharp edges
PVC Base
- Entirely corrosion proof
- Lightweight earth bars
- High impact
- Can offer galvnised base as an alternative
PB Connection Points
- Phosphor bronze bolts, nuts, flat and spring washer
- Not Brass
- PB has better conductivity and better corrosion properties for corrosive atmospheres
BS 7430
- Designed and manufactured in accordance with BS7430 : Code of practice for protective earthing of electrical installations
AN Wallis
“I have worked with Thorne & Derrick throughout my 20 year career in the Earthing & Lightning Protection industry – we have worked closely together on multiple major UK and international projects.
“We are now working together again, using the historical AN Wallis brand and our high quality earthing products coupled with the incredible Thorne & Derrick customer service, sales and marketing abilities and their exceptional digital content to bring the focus to AN Wallis so that it is the only name thought of when requiring Earthing materials / Lightning Protection products”
- Jason Leatherland, AN Wallis Business Development Manager – Wholesale & Distribution

Earthing Bars | Standard, Single & Twin Links | Manufactured from Copper by AN Wallis
FURTHER READING
- Earth Tape – The Manufacture of Copper Earthing Tapes
- High Voltage Earthing & Grounding System Design Protecting Lives
- Copper Earthing Tape & Rods Protecting 33kV Substation & Transformer Bund
- Substation Earthing

Thorne & Derrick
Thorne & Derrick distribute the most extensive range of Low & High Voltage Cable Installation & Electrical Distribution Equipment to the Power Transmission & Distribution industry in the onshore and offshore wind, solar, rail, oil/gas, data centre, battery storage and utility sectors.
We service UK and international clients working on underground and subsea cables, overhead lines, substations and electrical construction at LV, 11kV/33kV up to EHV transmission and distribution voltages.
Key Products: MV-HV Cable Joints & Terminations, Cable Cleats, Duct Seals, Cable Transits, Underground Cable Protection, Copper Earth Tapes, Cable Jointing Tools, Feeder Pillars, Cable Ducting, Earthing & Lightning Protection, Electrical Safety, Cable Glands, Arc Flash Protection & Fusegear.
Distributors for: 3M Electrical, ABB, Alroc, Band-It, Cembre, Centriforce, CMP, Elastimold, Ellis Patents, Emtelle, Furse, Lucy Zodion, Nexans Euromold, Pfisterer, Polypipe, ProGARM, Prysmian, and Roxtec.
- Scope –single-source supply of extensive range of products
- Stock – a multi-million pound stock holding provides complete global supply solutions
- Staff – technical support from a trained, proactive and friendly team
- Delivery – UK stock turnaround with express logistics to all international destinations
Specialist Electrical Equipment Distributors for High Voltage Power Systems